Photo Corners headlinesarchivemikepasini.com
![]()
A S C R A P B O O K O F S O L U T I O N S F O R T H E P H O T O G R A P H E R
![]()
Reviews of photography products that enhance the enjoyment of taking pictures. Published frequently but irregularly.
OpticFilm 120 Resolution Test


3 April 2013
Armed with LaserSoft Imaging's Resolution Target, based on the USAF-1951 standard, we took a Microtek M1 out of mothballs and called the CanoScan 9000F off the bench to compare to the OpticFilm 120. Then, just for fun, we added the Canon MG8120 multifunction device to the contest.
Manufacturer specs rank the OpticFilm 120 as the first seed with 10,600 dpi optical resolution, the CanoScan 9000F next at 9600 dpi and the M1 joining the MG8120 last at 4800 dpi.
And they do, in fact, represent three eras in scanning.
The M1 is the oldest, featuring a cold cathode fluorescent light source and a Sony CCD, even though (like the OpticFilm 120) it puts no glass between the scanning element and the film. The CanoScan and MG8120 use an LED light source, more common these days, as does the OpticFilm.
USAF Chart | Back to Contents
The optical resolution cited by the manufacturer represents an engineering ideal and is not representative of real world results.
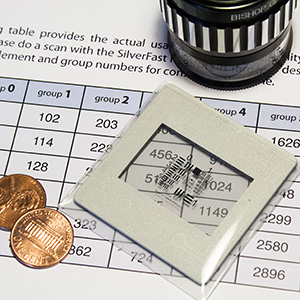
Small Target. The mounted target transparency on the SilverFast Imaging table.
Enter the USAF-1951 Resolution Test Chart. It's designed to show just how closely real world scans match the manufacturer's specification.
The chart's series of horizontal and vertical bars are arranged in sets of three to test the resolving power of both the horizontal and vertical resolution of a scanner.
They aren't always specified individually but the horizontal resolution is determined by how densely packed the photocells are on the CCD sensor itself while the vertical resolution relies on how finely the stepping motor moves across the image.
The M1 and the MG8120, for example, offer an optical resolution as 4800x9600 dpi. If you opt to go 9600 in one direction, you'll have to interpolate the 4800 up to 9600 in the other direction to avoid any distortion. But to avoid interpolation, you would simply scan at 4800 dpi.
Because the layout of the resolution target is known, a visual examination of its scan to find the smallest distinct set of bars can reveal the maximum number of dots per inch the scanner can see. You translate the location of the sharpest set on the target to a table of values to get that number.
Here's the table (G for Group, E for Element):
G0 G1 G2 G3 G4 G5 G6 G7 E1 51 102 203 406 813 1626 3251 6502 E2 57 114 228 456 912 1825 3649 7299 E3 64 128 256 512 1024 2048 4096 8193 E4 72 144 287 575 1149 2299 4598 9196 E5 81 161 323 645 1290 2580 5161 10322 E6 91 181 362 724 1448 2896 5793 11586 SilverFast Imaging provides an in-depth explanation of what the chart measures and how to use it. And it also sells the targets. You do want to buy the transparency target, although you can download reflective ones you can print and shoot with, say, all your lenses.
Note that the illustrations used in this review are 24-bit JPEG crops rendered from the larger 48-bit TIFF scans (except for the MG8120 scans, which we explain below). The actual area under examination is so small you don't notice it with the naked eye.
So what look like large discrepencies in this report are not quite that significant in practice (in a print, say). Here's the chart we published a few installments ago showing the scan resolution required for various print sizes:
Original Desc Scanner DPI Printer DPI Output H Output W 35mm frame Inkjet (min) 1,200 150 8.00 12.00 35mm frame Inkjet (min) 2,650 150 17.67 26.50 35mm frame Dye sub 10,600 300 35.33 53.00 35mm frame Inkjet (full) 10,600 450 23.56 35.33 35mm frame Inkjet (half) 5,300 450 11.78 17.67 35mm frame Inkjet (quarter) 2,650 450 5.89 8.83 35mm frame Lightroom max 10,600 722 14.68 22.02 In the real world sharpness is more than resolution. It's also acutance, which is famously manipulated with unsharp masking.
Consequently, we scanned a test image at the same settings as the target. That means there was no unsharp masking, no multi-exposure, no enhancements to distract from the resolving power of the various scanners. Again, the JPEG crops of the TIFF scans are very small.
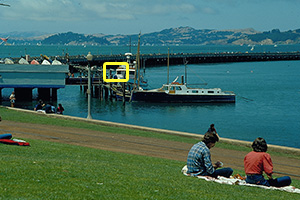
Test Image. The yellow box indicates the general area from which our crops were taken from this 35mm original.
One other note regarding our use of dots per inch for a resolution label. What we are measuring is the resolving power of the scanner. How many samples can it see per inch? You may be more comfortable calling this pixels per inch or lines per inch but we're using dots per inch.
SETTINGS | Back to Contents
Scanner settings to capture the chart are, however, not arbitrary. Except for the MG8120, we standardized on SilverFast so we could ensure each scanner was set up the same way but we had to slip back to SilverFast 6 for the M1 while using an unreleased version of SilverFast 8 for the OpticFilm 120 and 9000F.
We did try to use the latest release of VueScan on OS X with the M1 but it had trouble scanning at the M1's maximum optical resolution. It did fine at lower resolutions but at the maximum we saw vertical color lines throughout the background.
SilverFast recommends the following settings, which we enabled:
- In the General tab of Preferences, enable Gamma Gradation for HDR out.
- The type of scan was set to 48-bit HDR.
- Resolution was set to the maximum optical resolution (120 at 10,600, 9000F at 9600 and M1 at 4800).
- No imaging enhancements were enabled (indeed, 49-bit HDR disables almost all of them).
- Scans were saved as TIFFs.
SilverFast doesn't support the MG8120, so we used Image Capture to scan a 24-bit 4800-dpi JPEG.
EVALUATION | Back to Contents
To evaluate the scans, we opened them in Photoshop CS6 and viewed them at 100 percent. We simply picked the smallest set of horizontal and vertical bars that were distinct in the center of the image. They don't have to be within the same pair.
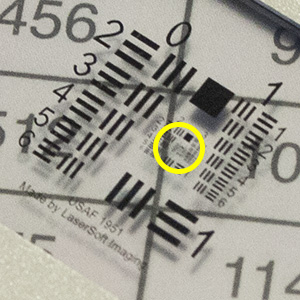
Evaluation. At 100 percent, we were only looking at the area in the yellow circle, which is reproduced below in the crops of the chart.
That was the easy part.
To determine the dots per inch our smallest distinct bars yielded, we first had to determine which Group and which Element of that group they were in. Then we had to look up that identifier on the DPI chart (there are other charts available to convert the reading to other dimensions).
The Group and Element are little obscure.
To find the Group, look at the number positioned between and above the horizontal and vertical pattern pair. You'll find 0 and 1 right away. To find 2 and 3 look in the middle of the chart. And 4 and 5 are further into the middle. And 6 and 7 even further. You are falling into a hole, Alice.
To find the Element, look to either the right or left side of the group patterns. We wondered why nobody at the U.S. Air Force thought to use letters instead of numbers to make this a little easier. Insert joke here.
You'll notice one other peculiarity. The first Element of a Group is often in the opposite corner from the rest of the Group. So Group 0's Element 1 is in the bottom right corner of the chart, not the top left with Element 2.
Got that? Great. We could be wrong, but we want you to play along.
MICROTEK M1 | Back to Contents
Let's start with third place. At 4800 dpi, the M1 provides the least optical resolution. That's why you see so much more information in the 250x250-pixel crops of the target and the test image.

Image. Saturated color.
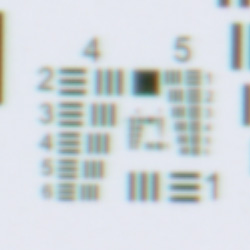
Chart. We called it a G4-E6.
Our evaluation of the central part of the resolution chart is that bars are distinct in Group 4 at Element 6. That means this M1 can achieve an output resolution of 1448 dpi.
CANOSCAN 9000F | Back to Contents
At 9600 dpi, the 9000F approaches the OpticFilm 120's 10,600 maximum optical resolution. The 250x250-pixel crops will show just a bit more of the image than the OpticFilm 120 crops. Of the three test images, the 9000F's scan is the least distinct with both lower contrast and lower saturation than the others.

Image. Not the best scan.
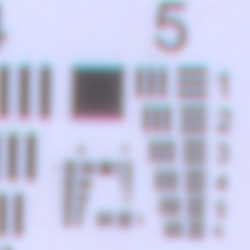
Chart. We called it a G5-E1.
Our evaluation of the central part of the resolution chart is that bars are distinct in Group 5 at Element 1. That means the 9000F actually achieves an output resolution of 1626 dpi.
OPTICFILM 120 | Back to Contents
At 10,600 dpi, the OpticFilm 120 isn't shy. Nikon's Super Coolscan 5000 only promised 4000 dpi (but nearly delivers it). The OpticFilm 120 surpasses the Nikon but still falls far short of its nominal resolution.
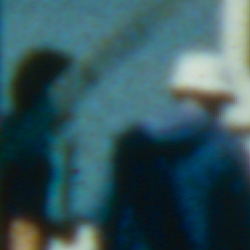
Image. Our favorite.
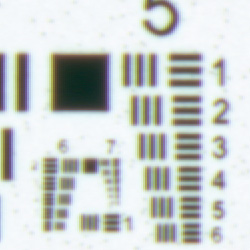
Chart. We called it a G6-E4.
Our evaluation of the central part of the resolution chart is that bars are distinct in Group 6 at Element 4. That means the OpticFilm 120 can achieve an output resolution of 4598 dpi. Compare that to 3650 dpi for the Nikon Super Coolscan 5000, 3200 dpi for an Imacon and 2300 dpi for the Epson V700/V750, which has been our recommended desktop scanner since we reviewed it in June 2007.
CANON MG8120 | Back to Contents
At 4800 dpi for film (4800x9600, according to the specs, but we have to throw out the high number to avoid interpolation of the low number), the MG8120 matches the M1's maximum optical resolution. The 250x250-pixel crops will show more of the image than the higher resolution crops.
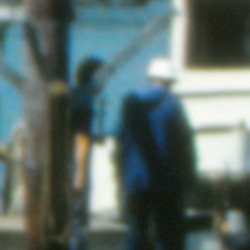
Image. Surprisingly good.
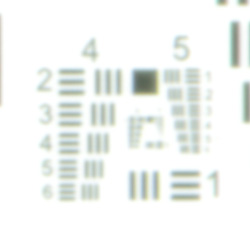
Chart. We called it a G5-E1.
Our evaluation of the central part of the resolution chart is that bars are distinct in Group 5 at Element 1, just like the 9000F. So the MG8120 also achieves an output resolution of 1626 dpi.
Feel free to dispute our findings, which you may find a bit conservative. Just find the smallest distinct pattern in the chart and look it up in the table.
NIKON D300 | Back to Contents
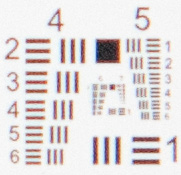
Chart. We called it a G5-E6.
Update (6 Dec.): Since the topic occasionally comes up, we thought we'd shoot the USAF target with a dSLR. The result is shown to the right.
Our setup was a modest Nikon D300 with an old 50mm f1.4 lens mounted with a BR-2 reversing ring to give us a macro range. We put the slide itself in an old Coolpix slide adapter and aligned the two manually. Natural light for illumination. We focused using Live View.
That's not a perfect setup of course. We'd build a rig if we were going to do this for production work.
But we might. You can see the results, as far as resolution go, rival the OpticFilm and surpass the others. Distinct lines are seen at G5-E6, ranking it at 2896 dpi. The one hitch is that camera interpolates color while the scanners all have individual red, green and blue readings for each pixel. The chart is, consequently, not quite neutral.
Still, looks like we might have to build that rig.
WRAP UP | Back to Contents
It's pretty clear that the OpticFilm 120 delivers higher resolution scans of this group. At upwards of 4500 dpi, it surpasses the Nikon Coolscan, Imacon and Epson V700/V750 too.
Resolution is important but it's only one factor in evaluating a scanner.
So stick around for the final installment of this review, informed by discussions with several of the people involved in bringing the OpticFilm 120 to market. That's when we'll weigh all the factors.
Comments
I linked from my blog to your very interesting blog. Especially I linked to the Opticfilm 120 articles. I hope this is ok.
-- Reinhold Roppert
Ja, danke! -- Mike